デバッグ

![]()
![]()
![]()
![]()
Node.js コアのデバッグ技術をモデルにした小さな JavaScript デバッグ ユーティリティで、Node.js および Web ブラウザーで動作します。
インストール
1$ npm install debug
使用法
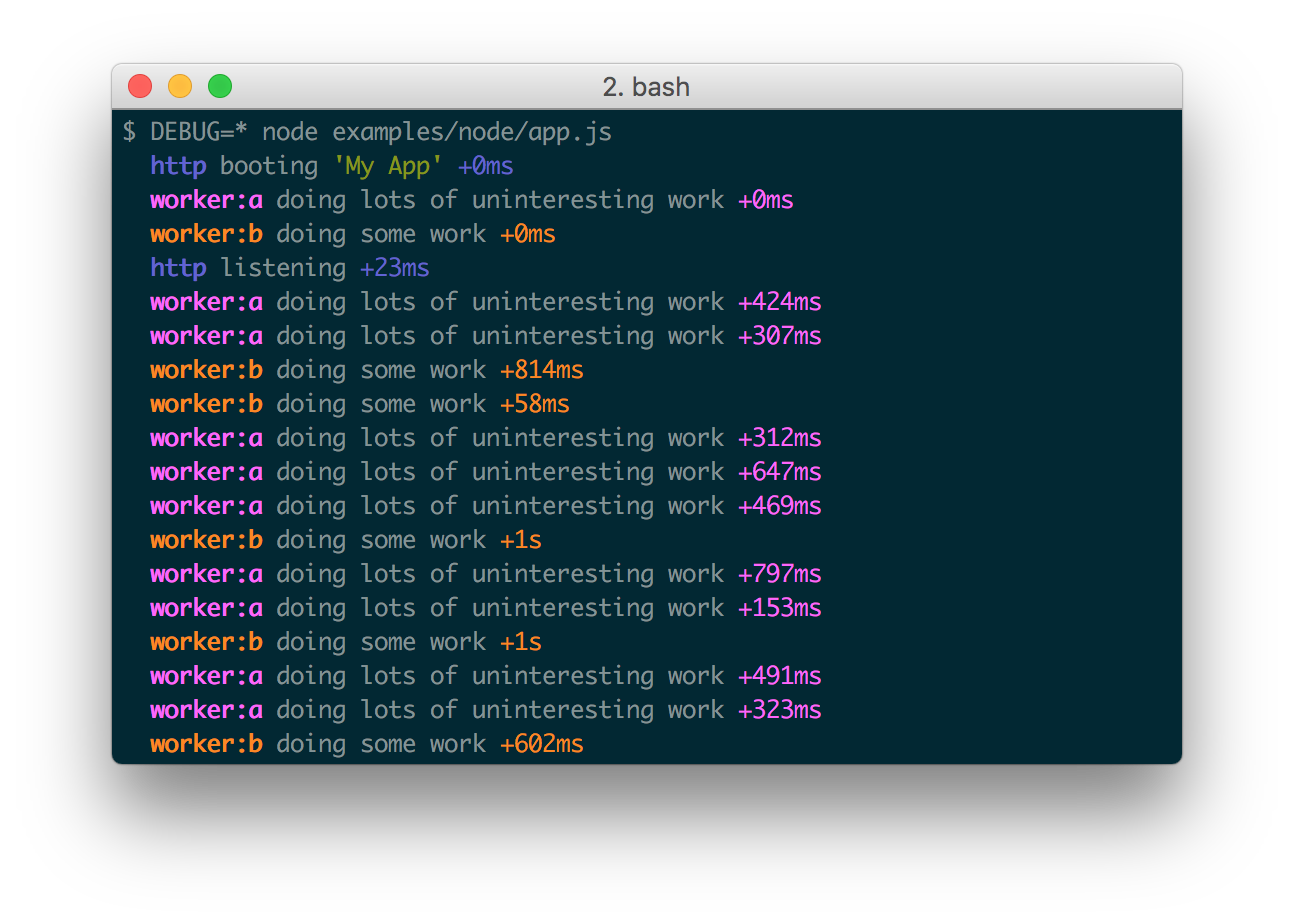
debug関数を公開します。この関数にモジュールの名前を渡すだけで、console.errorデバッグ ステートメントを渡すための装飾されたバージョンが返されます。これにより、モジュールだけでなくモジュールのさまざまな部分のデバッグ出力を切り替えることができます。全体として。
app.jsの例:
1
2
3
4
5
6
7
8
9
10
11
12
13
14
15
16
17
18var debug = require('debug')('http')
  , http = require('http')
  , name = 'My App';

// fake app

debug('booting %o', name);

http.createServer(function(req, res){
  debug(req.method + ' ' + req.url);
  res.end('hello\n');
}).listen(3000, function(){
  debug('listening');
});

// fake worker of some kind

require('./worker');
1
2
3
4
5
6
7
8
9
10
11
12
13
14
15
16var a = require('debug')('worker:a')
  , b = require('debug')('worker:b');

function work() {
  a('doing lots of uninteresting work');
  setTimeout(work, Math.random() * 1000);
}

work();

function workb() {
  b('doing some work');
  setTimeout(workb, Math.random() * 2000);
}

workb();
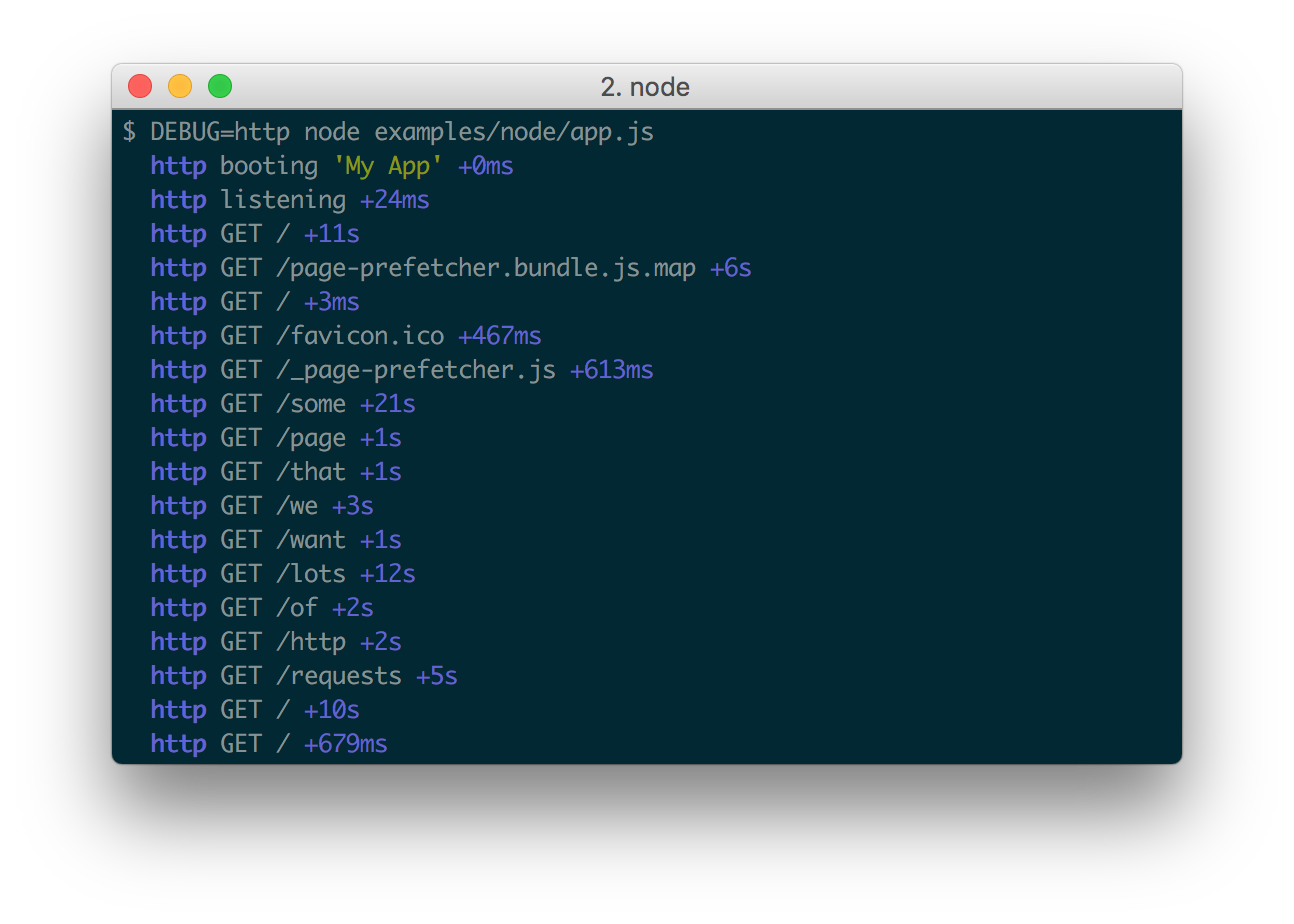
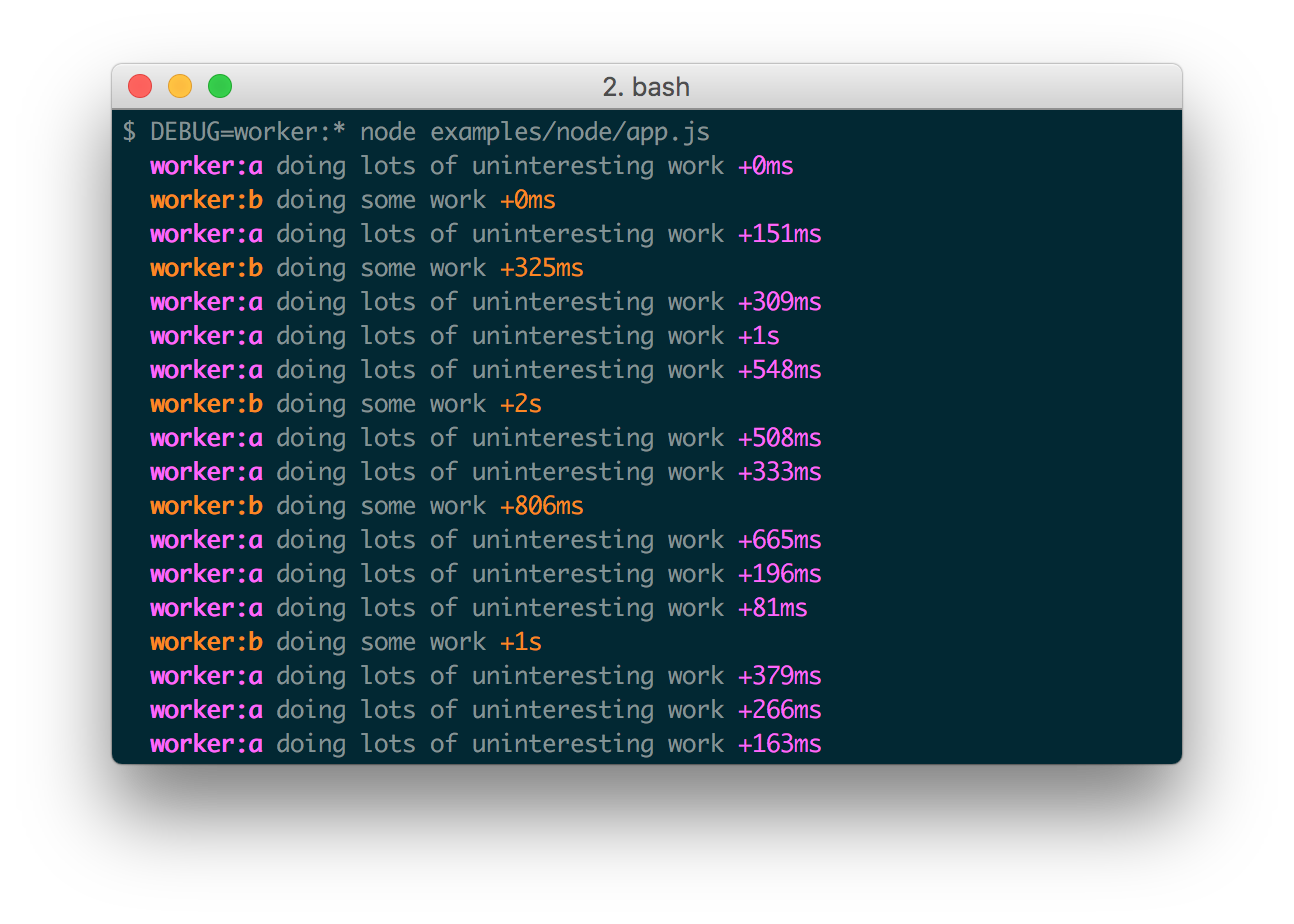
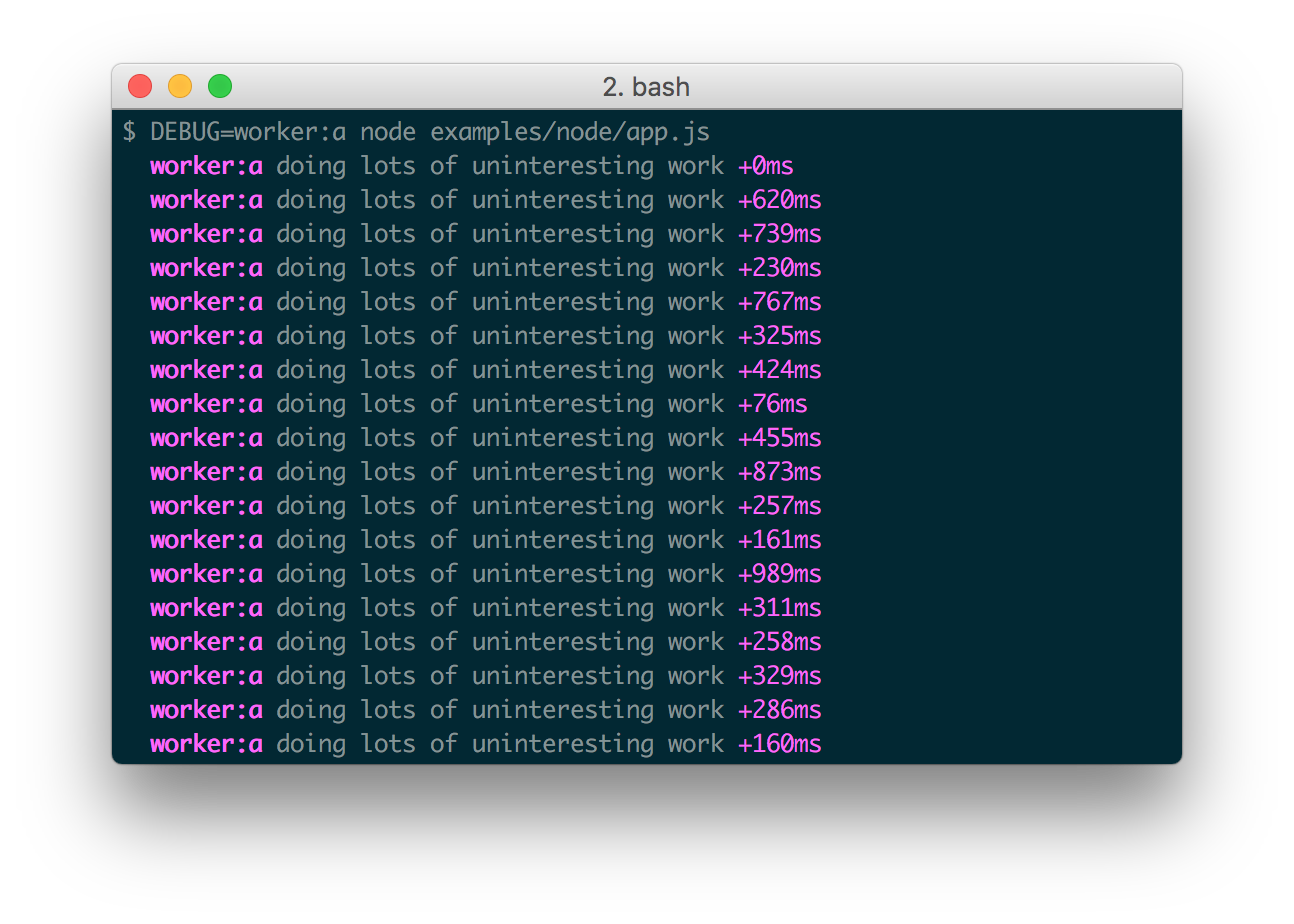
次に、環境DEBUG変数を使用して、スペースまたはカンマ区切りの名前に基づいてこれらを有効にします。
ここではいくつかの例を示します。
Windowsのメモ
Windows では、環境変数はsetコマンドを使用して設定されます。
1set DEBUG=*,-not_this
PowerShell は環境変数を設定するために異なる構文を使用することに注意してください。
1$env:DEBUG = "*,-not_this"
その後、通常どおりデバッグ対象のプログラムを実行します。
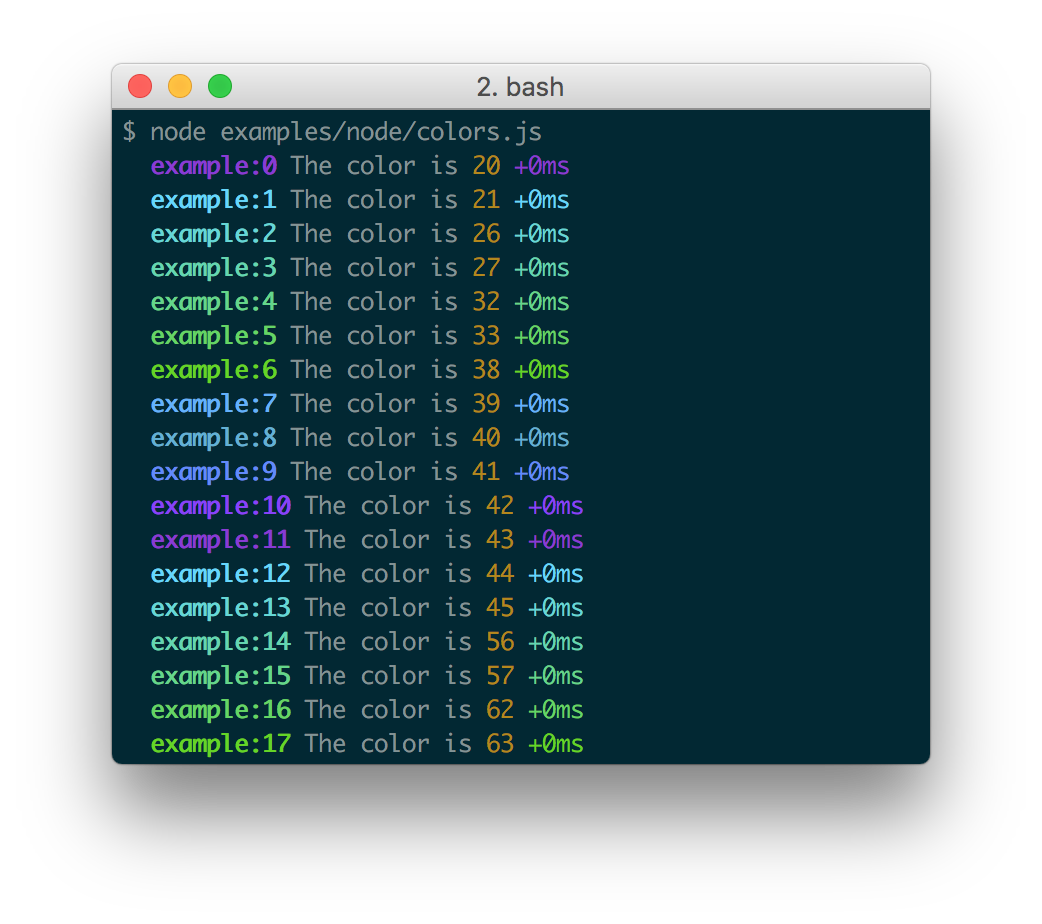
名前空間の色
すべてのデバッグ インスタンスには、名前空間名に基づいて生成された色が付いているため、デバッグ出力を視覚的に解析して、デバッグ行がどのデバッグ インスタンスに属しているかを識別するときに役立ちます。
Node.js
Node.js では、stderr が TTY のときに色が有効になります。また、デバッグと同時にモジュールをインストールする必要がありますsupports-color。そうしないと、デバッグで少数の基本色しか使用されなくなります。
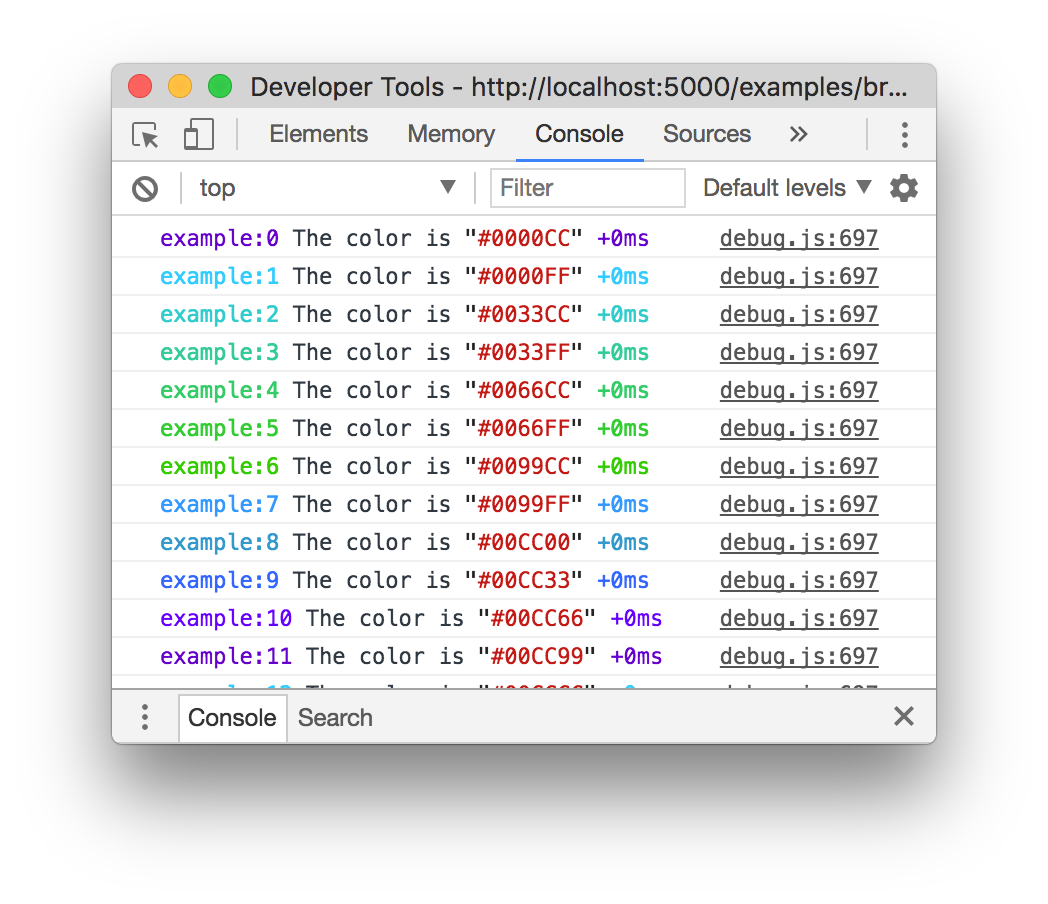
ウェブブラウザ
色は、書式設定オプションを理解する「Web インスペクター」でも有効です%c。これらは、WebKit Web インスペクター、Firefox (バージョン 31 以降)、および Firefox 用の Firebug プラグイン (任意のバージョン) です。
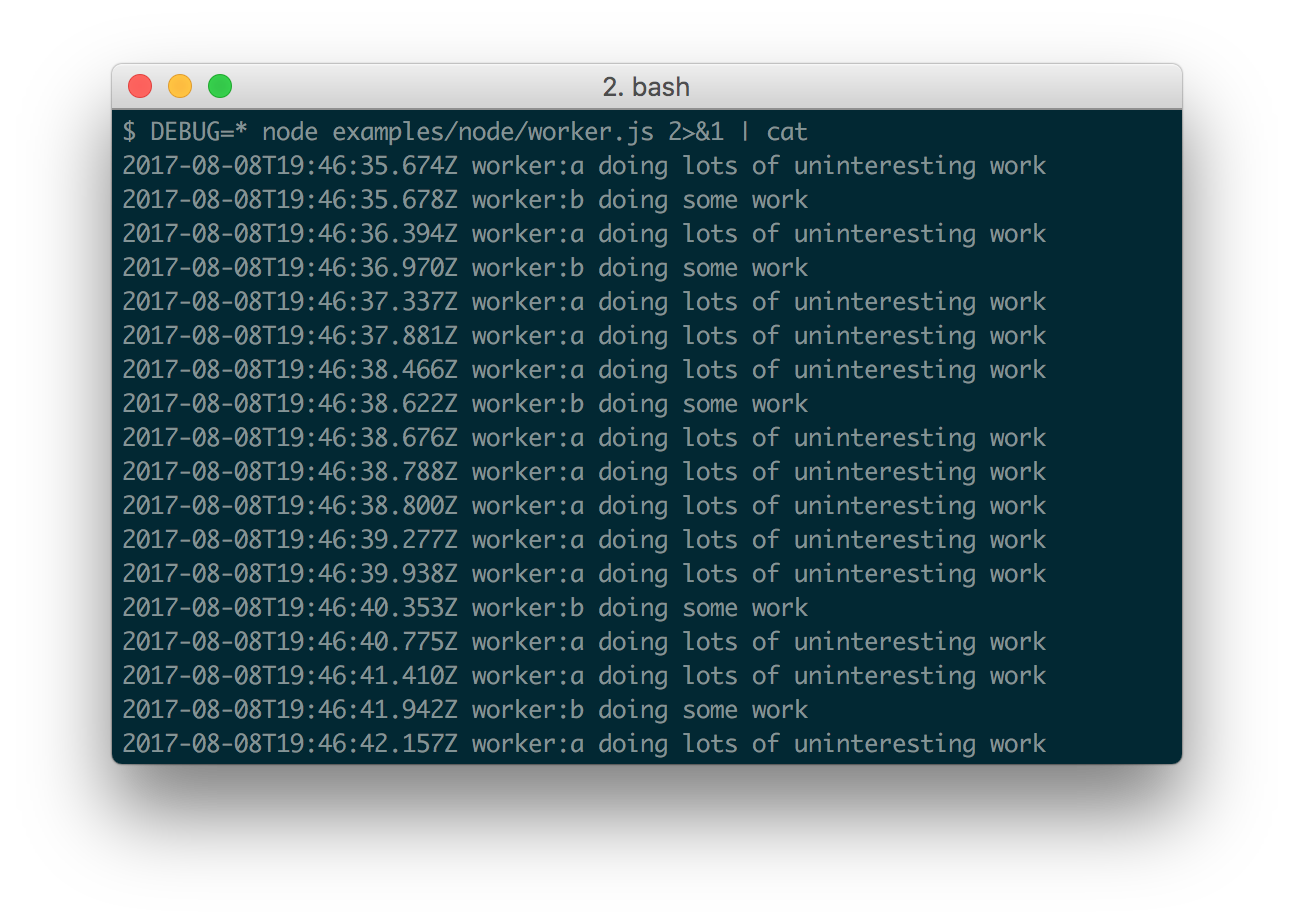
ミリ秒の差分
アプリケーションを積極的に開発している場合、ある呼び出しから次の呼び出しまでにかかった時間を確認すると便利ですdebug()。たとえば、debug()リソースを要求する前と要求した後に呼び出したと仮定すると、「+NNNms」でどれくらいの時間がかかったかが表示されます。通話の合間に。
stdout が TTY ではない場合、Date#toISOString()が使用され、以下に示すようにデバッグ情報をログに記録するのにさらに役立ちます。
慣例
1 つ以上のライブラリでこれを使用している場合は、開発者が名前を推測せずに必要に応じてデバッグを切り替えることができるように、ライブラリの名前を使用する必要があります。複数のデバッガがある場合は、ライブラリ名を先頭に付ける必要があります。機能を区切るには「:」を使用します。たとえば、Connect の「bodyParser」は「connect:bodyParser」になります。名前の末尾に「*」を追加すると、DEBUG の設定に関係なく常に有効になります。環境変数。これを通常の出力だけでなくデバッグ出力にも使用できます。
ワイルドカード
この*文字はワイルドカードとして使用できます。たとえば、ライブラリに「connect:bodyParser」、「connect:compress」、「connect:session」という名前のデバッガがあるとします。これら 3 つすべてを でリストする代わりに、
DEBUG=connect:bodyParser,connect:compress,connect:session単に を実行する
DEBUG=connect:*か、実行するだけで済みます。このモジュールを使用するものはすべて単に を使用しますDEBUG=*。
また、特定のデバッガーに「-」文字を接頭辞として付けて除外することもできます。たとえば、DEBUG=*,-connect:*「connect:」で始まるデバッガーを除くすべてのデバッガーが含まれます。
環境変数
Node.js を介して実行する場合、デバッグ ログの動作を変更するいくつかの環境変数を設定できます。
| 名前 | 目的 |
|---|---|
DEBUG |
特定のデバッグ名前空間を有効または無効にします。 |
DEBUG_HIDE_DATE |
デバッグ出力から日付を非表示にします (TTY 以外)。 |
DEBUG_COLORS |
デバッグ出力で色を使用するかどうか。 |
DEBUG_DEPTH |
オブジェクト検査の深さ。 |
DEBUG_SHOW_HIDDEN |
検査されたオブジェクトの非表示プロパティを表示します。 |
注:で始まる環境変数は、/フォーマッタDEBUG_で使用されるオプション オブジェクトに変換されることになります。
完全なリストについては、Node.js ドキュメントを参照してください
。%o%Outil.inspect()
フォーマッタ
デバッグではprintf スタイルの書式設定が使用されます。公式にサポートされているフォーマッタは次のとおりです。
| フォーマッタ | 表現 |
|---|---|
%O |
オブジェクトを複数行に整形して表示します。 |
%o |
オブジェクトをすべて 1 行に整形して表示します。 |
%s |
弦。 |
%d |
数値 (整数と浮動小数点の両方)。 |
%j |
JSON。引数に循環参照が含まれる場合は、文字列「[Circular]」に置き換えられます。 |
%% |
単一のパーセント記号 ('%')。これには引数は必要ありません。 |
Custom formatters
オブジェクトを拡張することでカスタム フォーマッタを追加できますdebug.formatters。たとえば、 を使用してバッファを 16 進数としてレンダリングするためのサポートを追加したい場合は
%h、次のようなことができます。
1
2
3
4
5
6
7
8
9const createDebug = require('debug')
createDebug.formatters.h = (v) => {
  return v.toString('hex')
}

// …elsewhere
const debug = createDebug('foo')
debug('this is hex: %h', new Buffer('hello world'))
//   foo this is hex: 68656c6c6f20776f726c6421 +0ms
ブラウザのサポート
browserifyを使用してブラウザ対応スクリプトを構築することも、自分で構築したくない場合は、browserify-as-a-service buildを使用することもできます。
現在、デバッグの有効状態は によって保持されています。以下に示す、と があり、両方をデバッグしたいlocalStorage状況を考えてください。これを使用して有効にできます。worker:aworker:blocalStorage.debug
1localStorage.debug = 'worker:*'
そしてページを更新します。
1
2
3
4
5
6
7
8
9
10a = debug('worker:a');
b = debug('worker:b');

setInterval(function(){
  a('doing some work');
}, 1000);

setInterval(function(){
  b('doing some work');
}, 1200);
出力ストリーム
デフォルトではdebugstderr にログが記録されますが、メソッドをオーバーライドすることで名前空間ごとに設定できますlog。
1
2
3
4
5
6
7
8
9
10
11
12
13
14
15
16
17var debug = require('debug');
var error = debug('app:error');

// by default stderr is used
error('goes to stderr!');

var log = debug('app:log');
// set this namespace to log via console.log
log.log = console.log.bind(console); // don't forget to bind to console!
log('goes to stdout');
error('still goes to stderr!');

// set all output to go via console.info
// overrides all per-namespace log settings
debug.log = console.info.bind(console);
error('now goes to stdout via console.info');
log('still goes to stdout, but via console.info now');
動的に設定
次のメソッドを呼び出して、デバッグを動的に有効にすることもできますenable()。
1
2
3
4
5
6
7
8
9let debug = require('debug');

console.log(1, debug.enabled('test'));

debug.enable('test');
console.log(2, debug.enabled('test'));

debug.disable();
console.log(3, debug.enabled('test'));
印刷:
1
2
31 false
2 true
3 false
使用法:enable(namespaces)namespacesコロンとワイルドカードで区切られたモードを含めることができます。
を呼び出すと、enable()以前に設定された DEBUG 変数が完全にオーバーライドされることに注意してください。
1
2$ DEBUG=foo node -e 'var dbg = require("debug"); dbg.enable("bar"); console.log(dbg.enabled("foo"))'
=> false
デバッグターゲットが有効かどうかの確認
デバッグ インスタンスを作成した後、プロパティを確認することで、それが有効かどうかを判断できますenabled。
1
2
3
4
5const debug = require('debug')('http');

if (debug.enabled) {
  // do stuff...
}
このプロパティを手動で切り替えて、デバッグ インスタンスを強制的に有効または無効にすることもできます。
著者
- TJ ホロウェイチャク
- ネイサン・ラジリッチ
- アンドリュー・ライン
後援者
毎月のご寄付で私たちをサポートし、活動継続にご協力ください。
![]()
![]()
![]()
![]()
![]()
![]()
![]()
![]()
![]()
![]()
![]()
![]()
![]()
![]()
![]()
![]()
![]()
![]()
![]()
![]()
![]()
![]()
![]()
![]()
![]()
![]()
![]()
![]()
![]()
![]()
スポンサー
スポンサーになり、Github の README でロゴをサイトへのリンクとともに取得してください。 [スポンサーになる]
![]()
![]()
![]()
![]()
![]()
![]()
![]()
![]()
![]()
![]()
![]()
![]()
![]()
![]()
![]()
![]()
![]()
![]()
![]()
![]()
![]()
![]()
![]()
![]()
![]()
![]()
![]()
![]()
![]()
![]()
ライセンス
(MITライセンス)
著作権 (c) 2014-2017 TJ Holowaychuk <tj@vision-media.ca>
本ソフトウェアおよび関連ドキュメント ファイル (以下「ソフトウェア」) のコピーを入手した人には、使用、コピー、変更、マージする権利を含むがこれらに限定されない、制限なくソフトウェアを取り扱う許可が、ここに無償で与えられます。 、以下の条件を条件として、本ソフトウェアのコピーを出版、配布、サブライセンス、および/または販売すること、および本ソフトウェアが提供される人物にそれを許可すること。
上記の著作権表示およびこの許可通知は、ソフトウェアのすべてのコピーまたは主要部分に含まれるものとします。
ソフトウェアは「現状のまま」で提供され、明示的か黙示的かを問わず、商品性、特定目的への適合性、および非侵害の保証を含むがこれらに限定されない、いかなる種類の保証も行われません。契約行為、不法行為、その他を問わず、ソフトウェアまたはソフトウェアの使用またはその他の取引に起因または関連して生じる請求、損害、またはその他の責任。